

Course Dev.
Course Deviation in Order to Find Stronger Lift
In his Corse Deviations article in the December 2011 issue of Soaring,
John Cochrane writes that it’s a mistake to measure course deviations using
distance, and that “the only thing that matters is how many degrees you go
of course.” This is always true when the course deviation is made in order
to avoid sink or to cruise through lift. If, however, we are deviating off
course in order to find stronger lift, this will only be true in a special
case when we are starting the glide at the top of a thermal and the next
turn point is very far away. Otherwise, a number of additional factors come
into play: the initial altitude, the maximum and minimum altitudes (the
working band), the aforementioned distance to the next turn point and
whether or not the stronger thermal can be reached in a single glide at or
above the minimum altitude.
The net gain or loss of time when making a course deviation in order to find
stronger lift can be calculated from a simple equation with the following
three factors:
- Ta = Total additional time spent in cruise (compared to staying on course).
- Tb = Additional time spent in the next climb in order to recover the altitude lost during Ta.
- Tc = Time saved by climbing in the stronger thermal, excluding Tb.
The total time difference dT can then be calculated as dT = Ta + Tb + Tc.
A negative dT indicates time saved while a positive dT indicates time lost.
When the starting altitude is below the maximum altitude, the maximum angle
of course deviation is usually 180°, meaning that back-tracking in order to
climb in a stronger thermal can save time overall. How far we can back-track
before the time-saved melts away and becomes time-lost, depends on the
thermal strengths, glider performance all the above mentioned additional
factors.
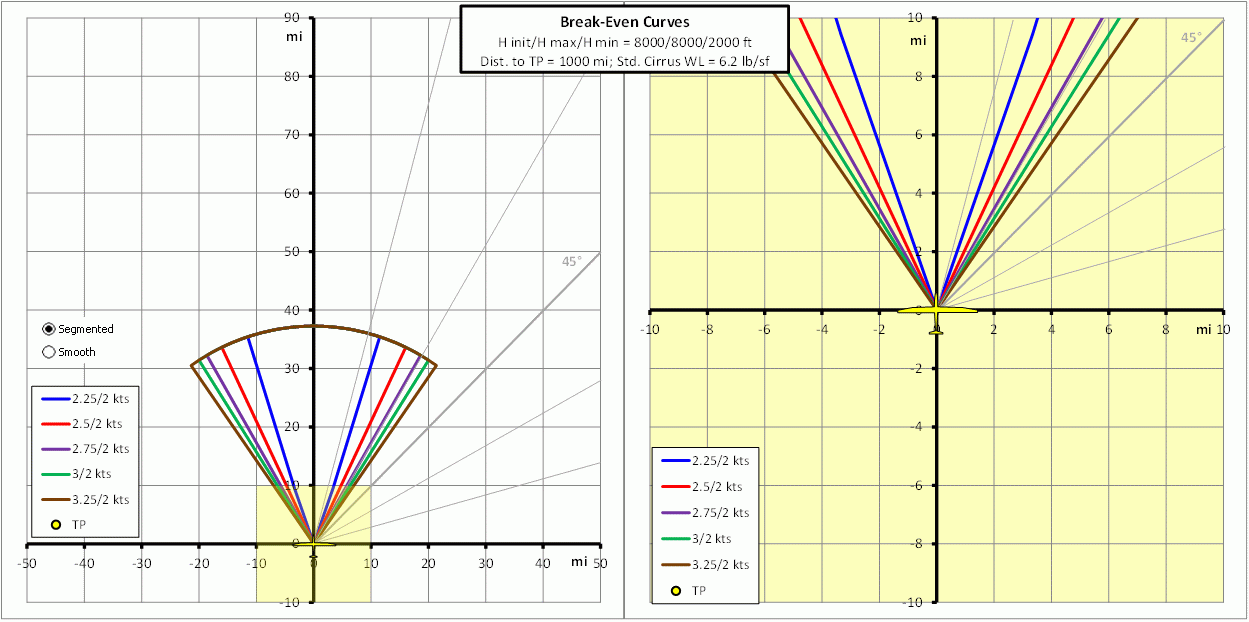
The graphs below show break-even lines for 5 different thermals off course,
compared to a 2 knot thermal on the course line and the special case
mentioned above. The graph on the right is zoomed in to within 10 miles from
the starting position. Note that the arc terminating the lines indicates how
far we can glide before reaching the minimum altitude. These graphs
demonstrate that, if starting the glide at the top of the thermal, and with
the next turn point far away, only the angle matters (assuming we can reach
the next thermal).
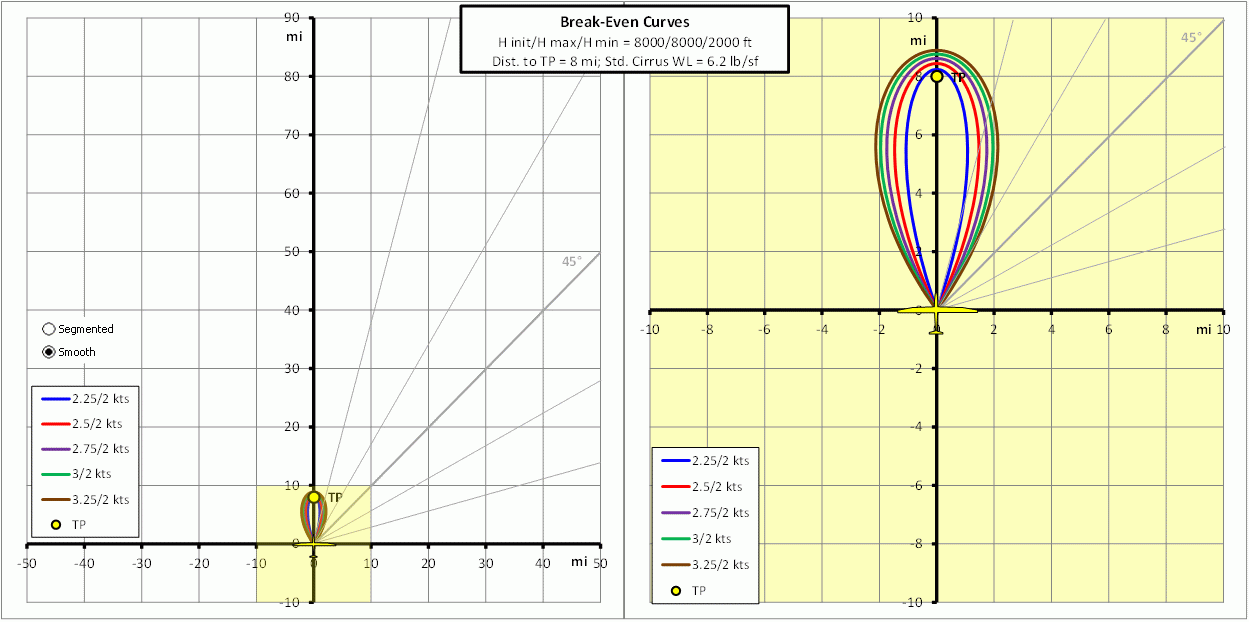
If we only change the distance to the next turn point from 1000 to 8 miles, the break-even lines turn into closed loops, as shown in the next set of graphs. Note that the loops close at some distance past the next turn point. This means that it may be beneficial to go past the turn point in order to find a stronger climb.
If we also reduce the starting altitude from 8,000 feet down to 3,000 feet, the break-even curves become even more interesting, indicating that back-tracking in order to find a stronger thermal could save us time.

For those interested in further exploring this topic, you can download the Excel spreadsheet used to produce the above graphs. The spreadsheet is interactive and allows you to change any of the parameters, including the glider polar and wing loading and the units of measure. You can also download a pdf with basic theory behind the calculations and the instructions on how to use the spreadsheet.
For any questions and comments, please email me at info@trimill.com
Downloads
| Simple Example Spreadsheet | Course Deviation in Order to Find Stronger Lift (No Wind, Simple Example).xls |
| Graphing Spreadsheet in Excel 2003 format | Course Deviation in Order to Find Stronger Lift (No Wind, Graphs).xls |
| Graphing Spreadsheet in Excel 2007/2010 format | Course Deviation in Order to Find Stronger Lift (No Wind, Graphs).xlsm |
| Theory and Instructions | Instructions_Course_Deviation_to_Find_Stronger_Lift.pdf |
Copyright © Trimill